Introduction

This article helps you get started with the TRIAX Network Analyser also called TNA. You will see the tool referred to as this - TNA.
Note: This guide does not cover the build-in analyser in the sw3.1 and upwards!
But first, what is TNA and what is the purpose of this tool?
TNA is a tool, that will help you in 3 different scenarios when dealing with TRIAX EoC.
- Before installing TRIAX EoC, in Pre-qualification.
- After installing TRIAX EoC, documenting the installation.
- Troubleshooting on a TRIAX EoC installation, finding different types of issues.
These 3 scenarios are described in different articles and will not be touch in this article.
This article will describe:
- The installation process.
- The preparations needed to use the tool.
- How to get started with the tool.
This article is based on TNA 4.35/SCT 4.1.8.
Note: TRIAX Network Analyser is not compatible with rev. A controller CT32/2 (383101) & 64/4 (383103).
TRIAX Network Analyser operates in the area from 0-190MHz. TNA is based on core software from 3rd party and made usable without the need for deep knowledge in how G.hn works. Basic understanding of coax installation and RF networking is a minimum requirement.
Monitoring and analysis of connected Ethernet endpoints (EPE's) are not included, only coax endpoints (EPC's and EMC's).
The following hardware is necessary for the setup:
- 1x Laptop
- Ethernet port for TNA connection to the controller
- Second ethernet port (ie USB to RJ46) or WiFi for remote access
- 1 or 2 Cat cables, depending on the remote connection.
The following software is necessary for the setup:
- Java Runtime Environment (JRE) - download from the internet
- WinPcap - included with the tool (pcap dir)
- TRIAX Network Analyser (TNA)
The installation process
TNA is based on Java. You must have Java Runtime Environment (JRE) installed on your PC.
Furthermore, you must have WinPcap installed. WinPcap is a "packet capture" library, used by TNA to read the traffic from the endpoints and controller. TNA has been validated with WinPcap 4.1.3.
Before you can get TNA to work, you must install WinPcap and JRE on your PC.
Installing TRIAX Network Analyser
- Download the TNA files from triax.com
- Copy/move the downloaded zip-file to ie c:\tools\
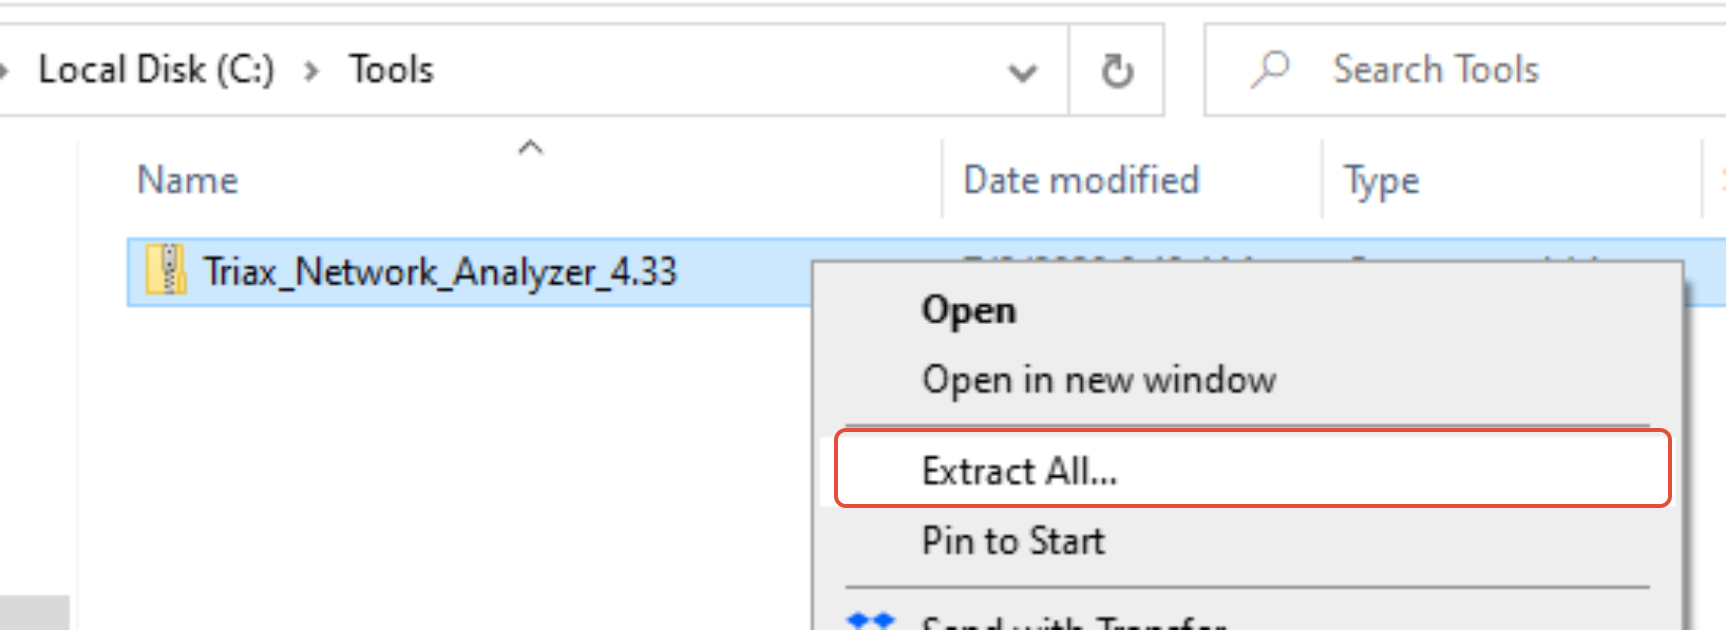
- Extract the folder by right-clicking the zip file and select "Extract all.."
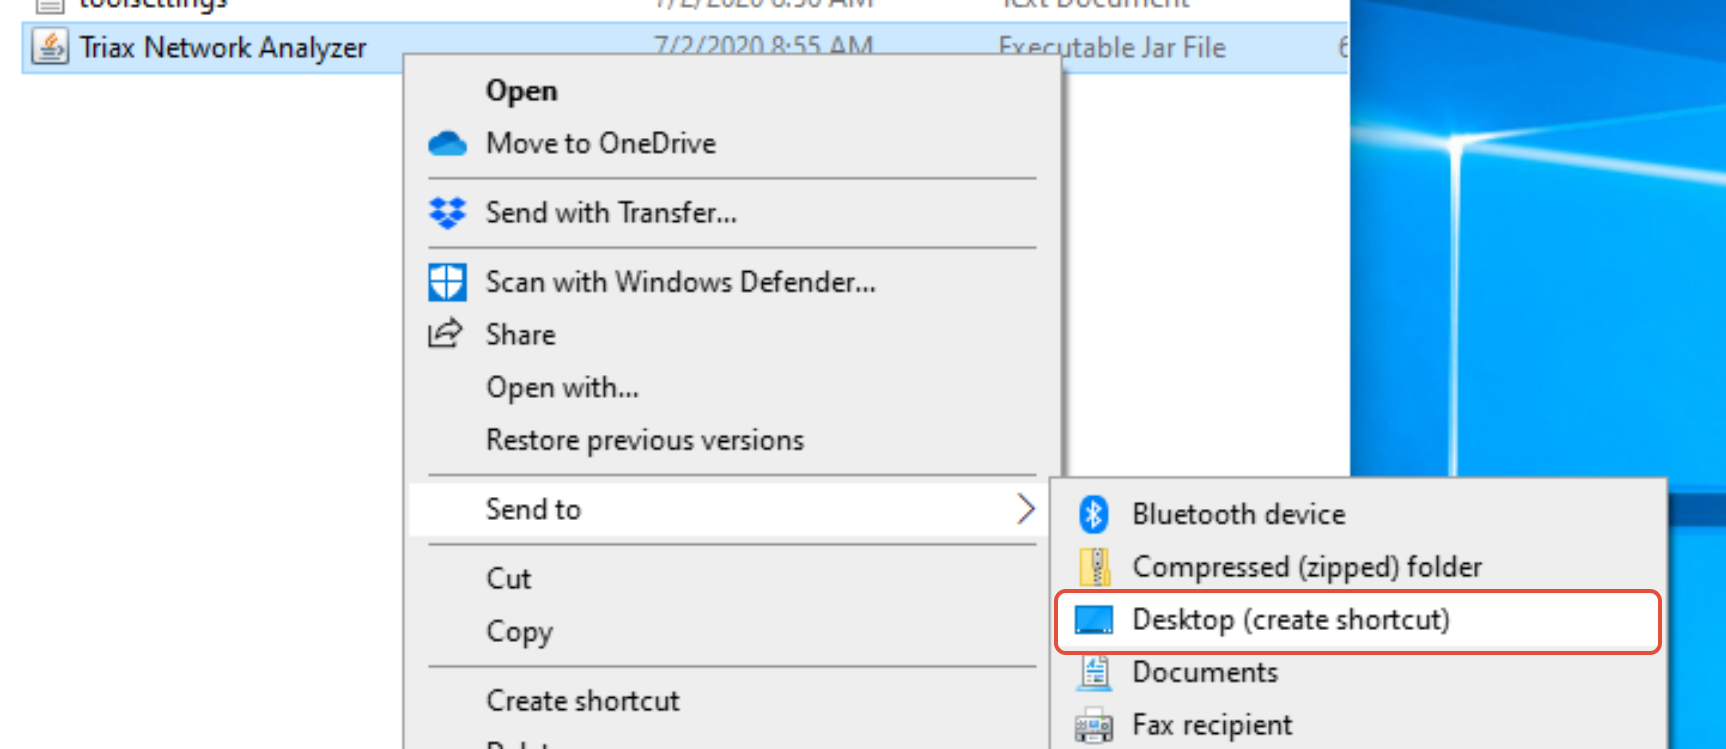
- In the newly extracted directory, right-click on "TRIAX Network Analyser.jar" (the executable Jar file) and create a shortcut to the desktop.
Installing JRE
- Download and run the executable from Java: Click here for download
- Follow the instructions on the screen.
- Java-based applications can now run on the PC.
Installing WinPcap
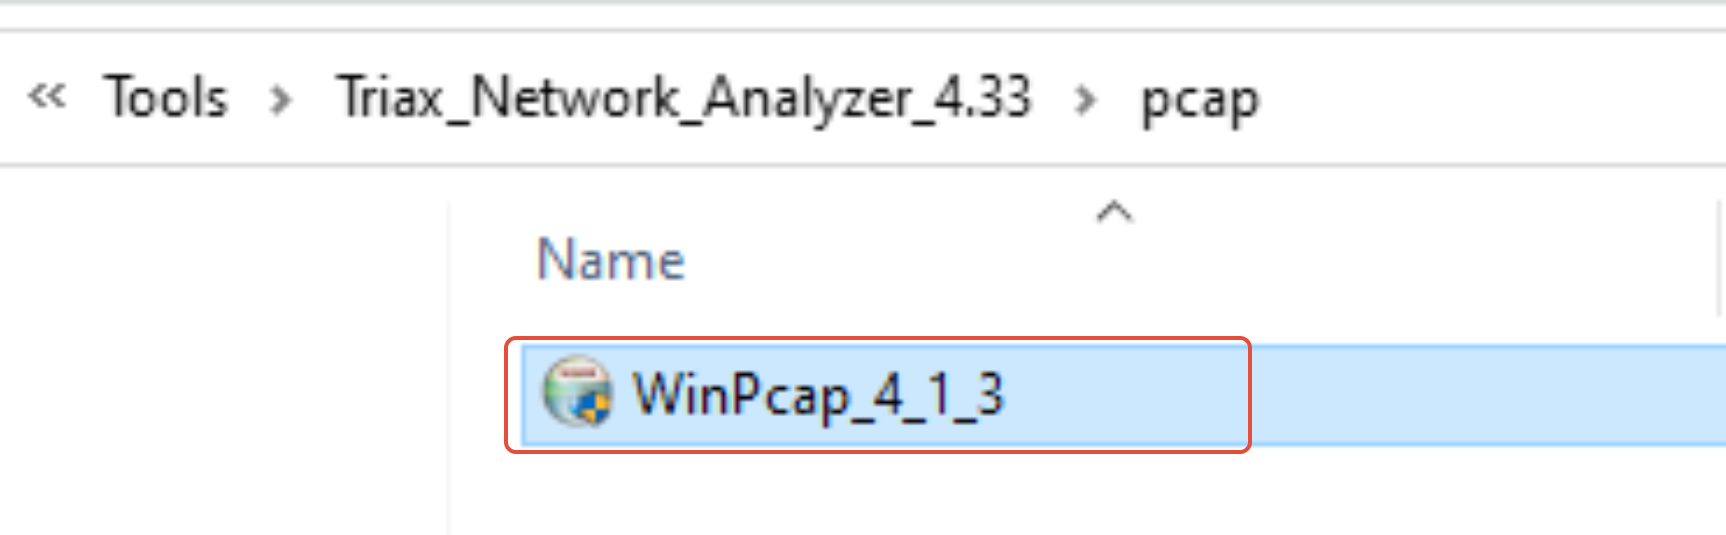
- Run the executable from WinPcap in the c:\tools\Triax_Network_Analyser_x.xx\pcap\ directory
- Follow the instructions on the screen. The installation application will automatically detect the operating system and install the correct drivers.
- The WinPcap-based applications are now ready to work.
This completes the software installation. Next step is the physical setup before you can configure both the PC and controller for communication.
The preparations needed to use the tool
With the necessary software installed on your laptop, you can proceed to the physical setup.
In the following example, the laptop is connected to eth4:

(Click on the image to enlarge it)
- Connect your laptop to a free port on the controller (not Eth1).
- Configure the Eth port on the controller, to "VLAN pass-through" (the port the laptop is connected to. Here is Eth4 selected).

- Configure a static IP address on the network interface on the PC, preferable in the 192.168.x.y range.
- Setup desired remote access on the laptop if you wish to use the setup for remote monitoring over a period.
How to use the tool
You are now ready to use the tool. Since this is the first startup of the TNA, you will experience it a bit different from the next time you will use it. The controller and the endpoints are without any IP addresses assigned. This will be handled in the next few steps.
1. Double-click on the shortcut, that you created in the installation process of TRIAX Network Analyser.

2. TNA will try to detect the EoC Domain masters.

3. TNA will prompt you with a connectivity error - Click "OK"
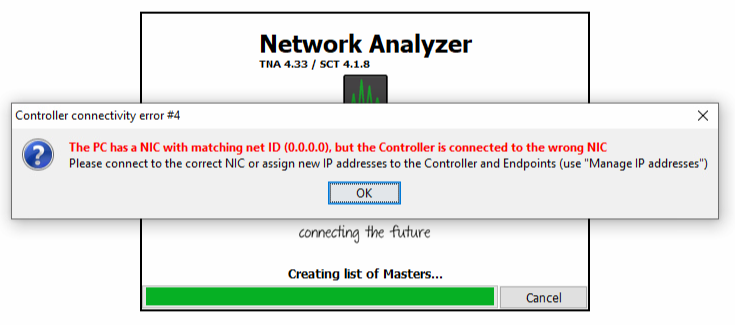
4. TNA will prompt you to correct this error - Click "OK"

5. TNA will prompt you with an "Invalid IP address" error - click "OK"

This will reappear until you have corrected the IP addresses for both the controller and connected endpoints.
6. Click on "Manage IP addresses"

7. Depending on the number of network interfaces on the PC, you will see 1 or more possibilities in the dropdown "Choose PC NIC" menu. Here there are 4 interfaces. Select the one connected to the controller port configured previously in this guide.

7. Select an IP scope in the "Address range start" dropdown.
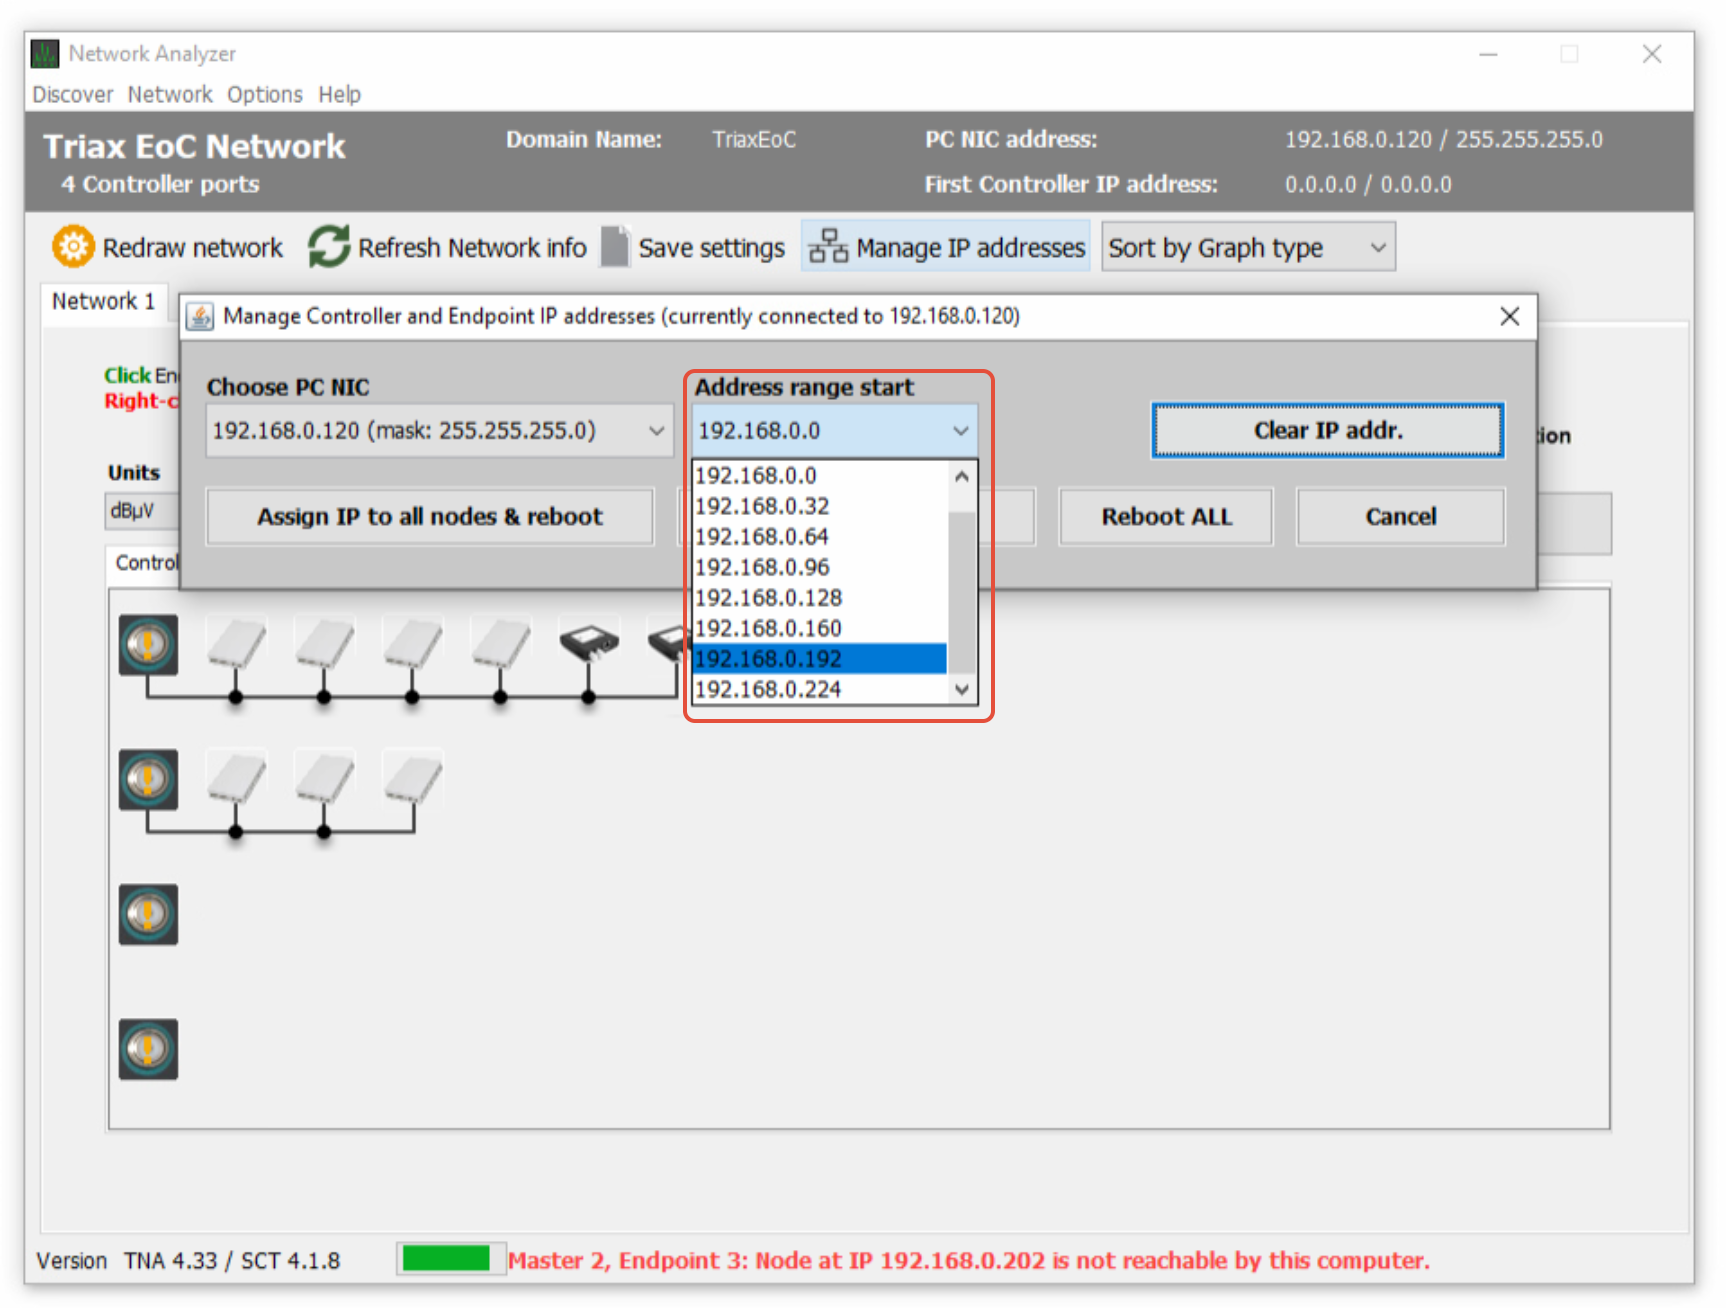
8. With correct values selected in the 2 dropdown menus, click on "Assign IP to all nodes & reboot".

9. Acknowledge that the system will reboot endpoints and the Eoc ports on the controller (Domain masters).

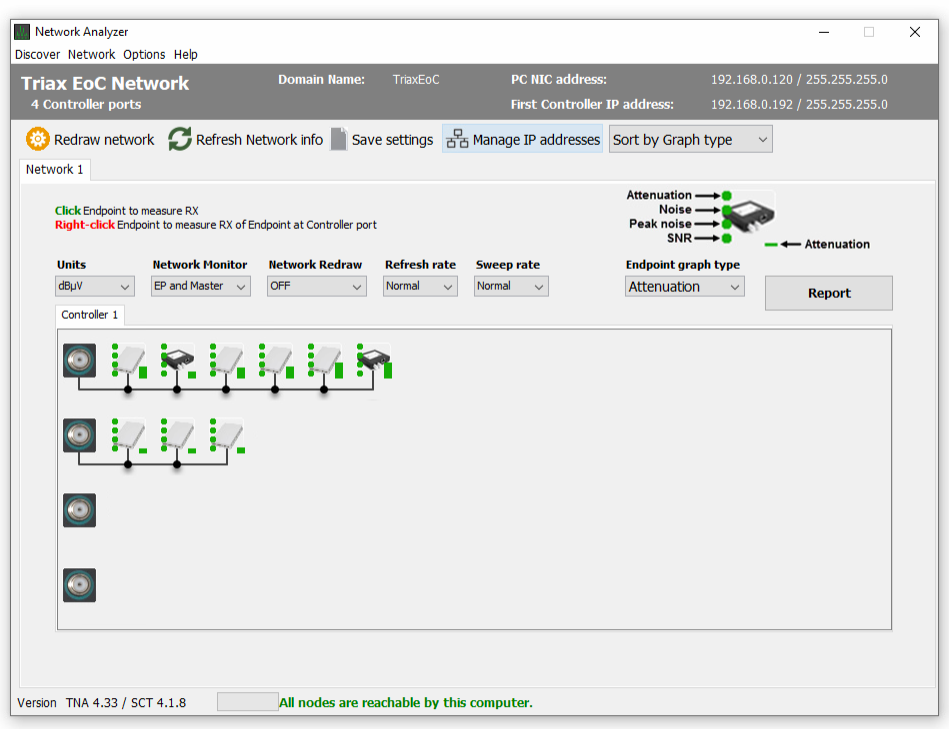
10. TNA will assign IP addresses to all endpoints and rediscover them.

11. TNA will gather information from all connected endpoints (coax only). TNA is ready when all endpoints values are represented with coloured dots and bar graph.
This completes the setup and configuration of TNA.
Next step
Next step will be explaining how TNA operates and how to use it. This article will not deep dive into the usage of the tool. TNA functionality will be explained in the following articles in the knowledgebase.
However, the tool is more or less self-explaining.
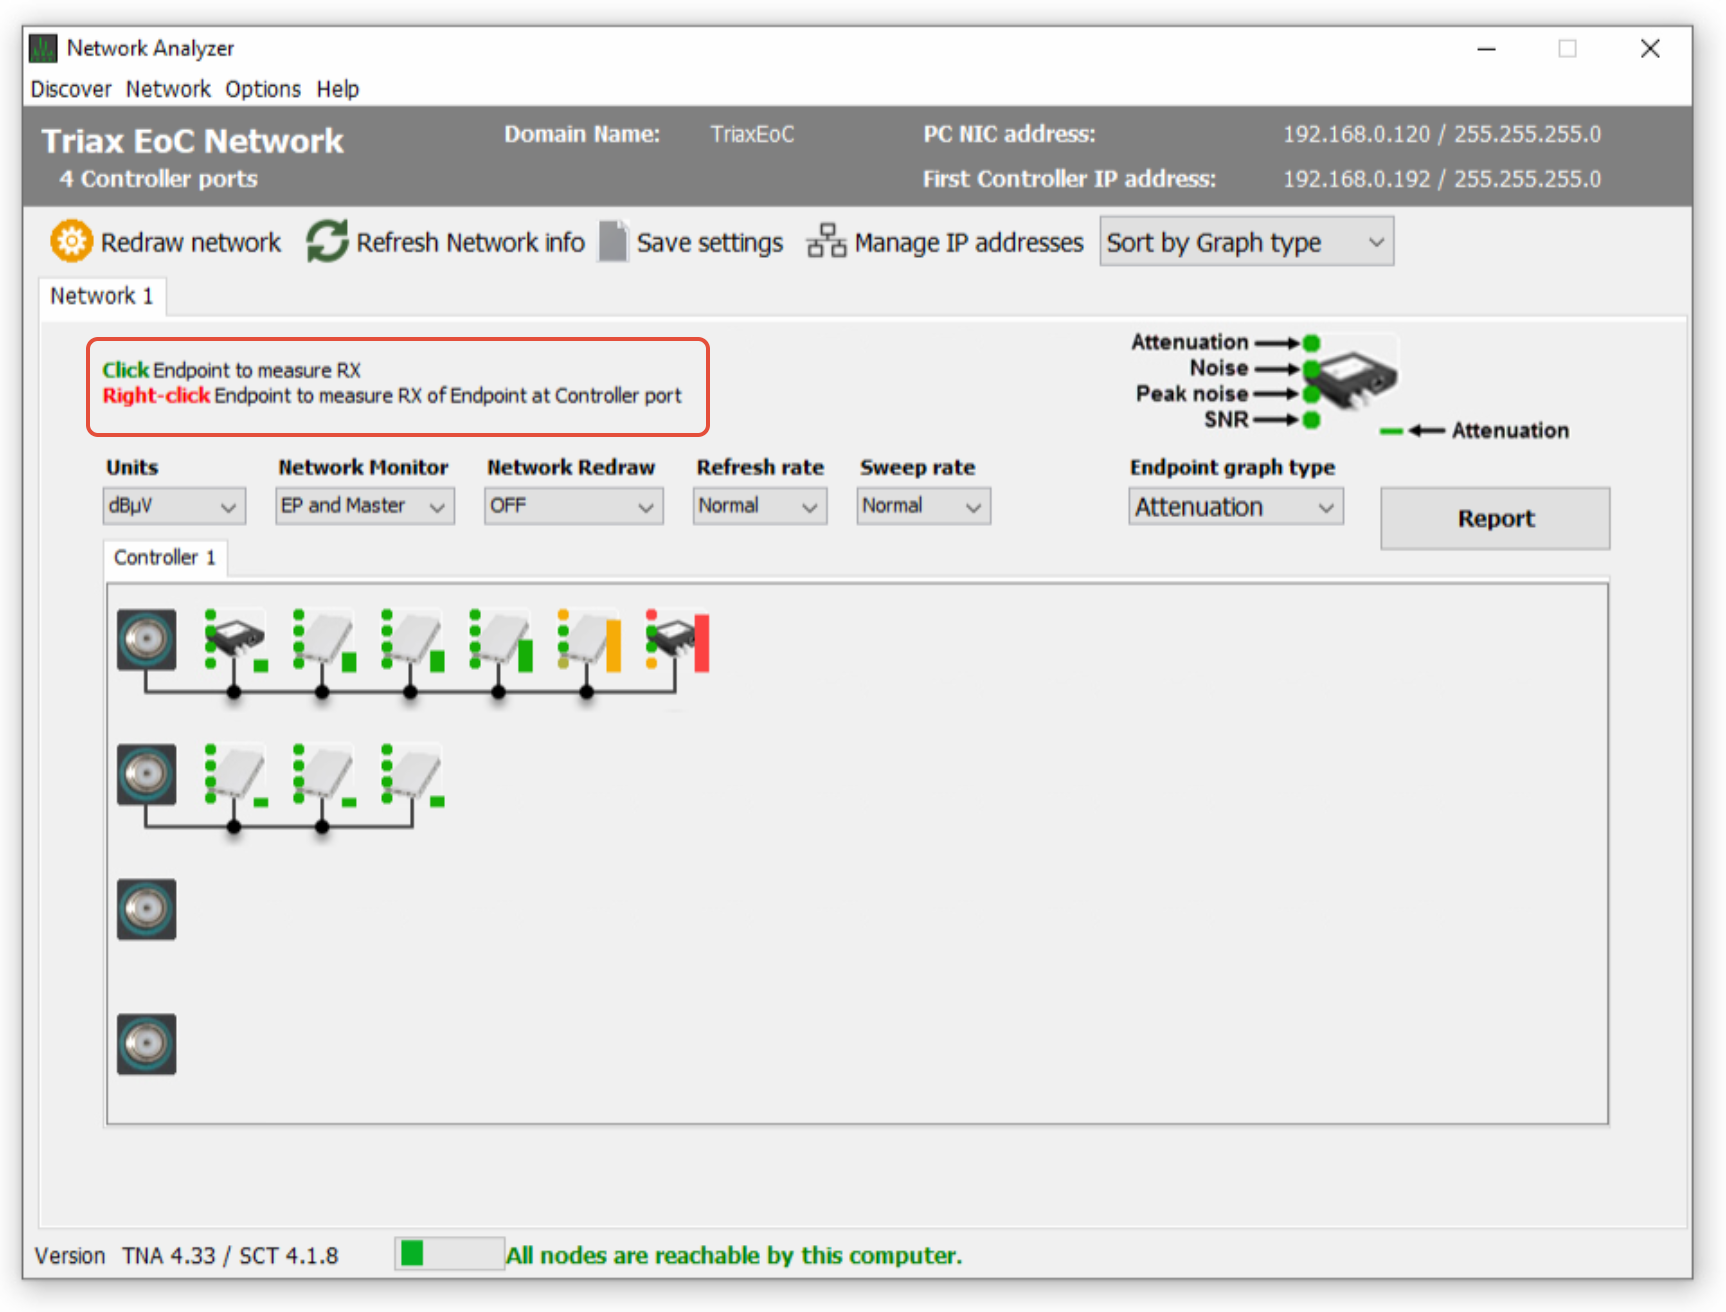
Hover over endpoint
A quick information popup will appear when hovering the mouse over an endpoint. Values are colourized to reflect the state of the endpoint.

Activating the graphs
To see the actual graphs, you need to click on an endpoint. As the tool states, you can either left or right-click an endpoint
This is an example of a graph
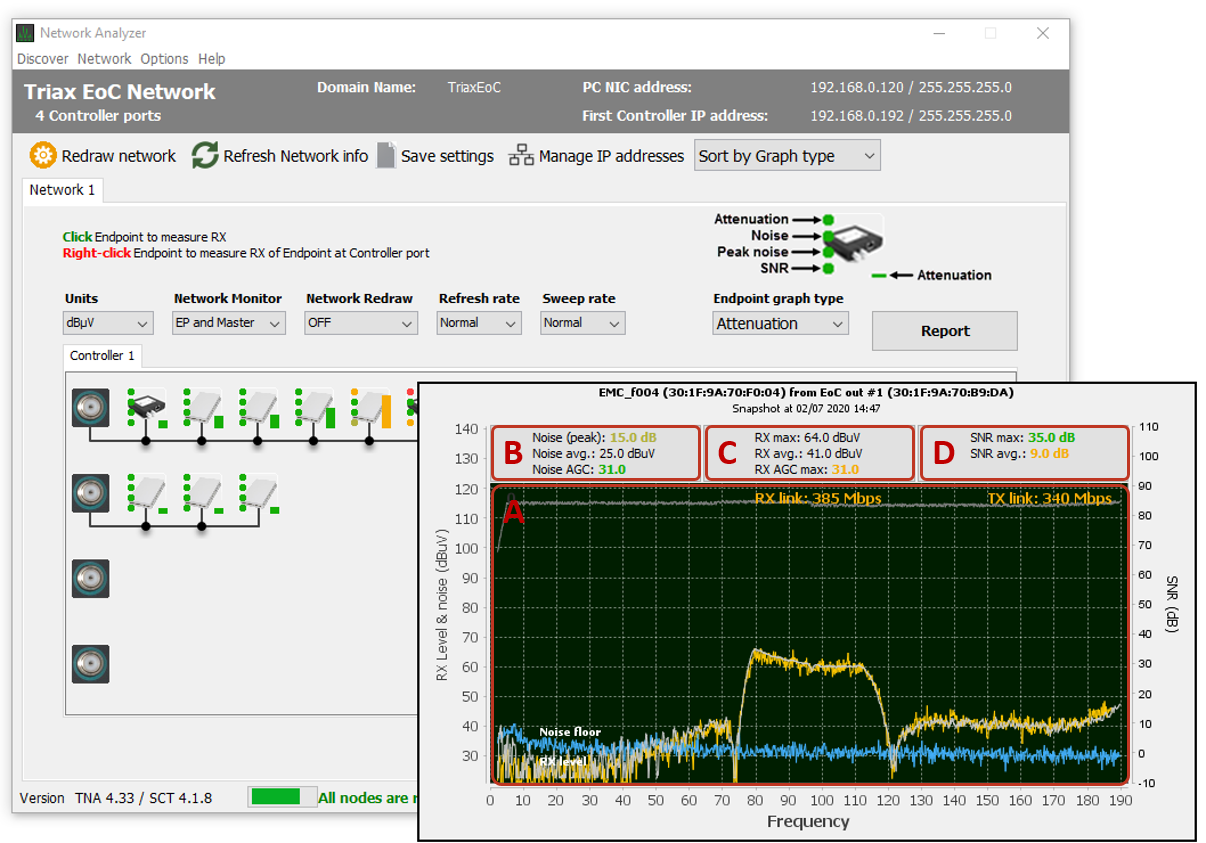
- A: Live graph showing all data
- B: Live graph showing Noise. Capable of faster refresh rate and Max/Min hold
- C: Live graph showing Rx power. Capable of faster refresh rate and Max/Min hold
- D: Live graph showing Signal to Noise ratio. Capable of faster refresh rate and Max/Min hold
Note: This article refers to separate articles in the TRIAX Support knowledgebase.
These articles will be continuously available and keep up to date